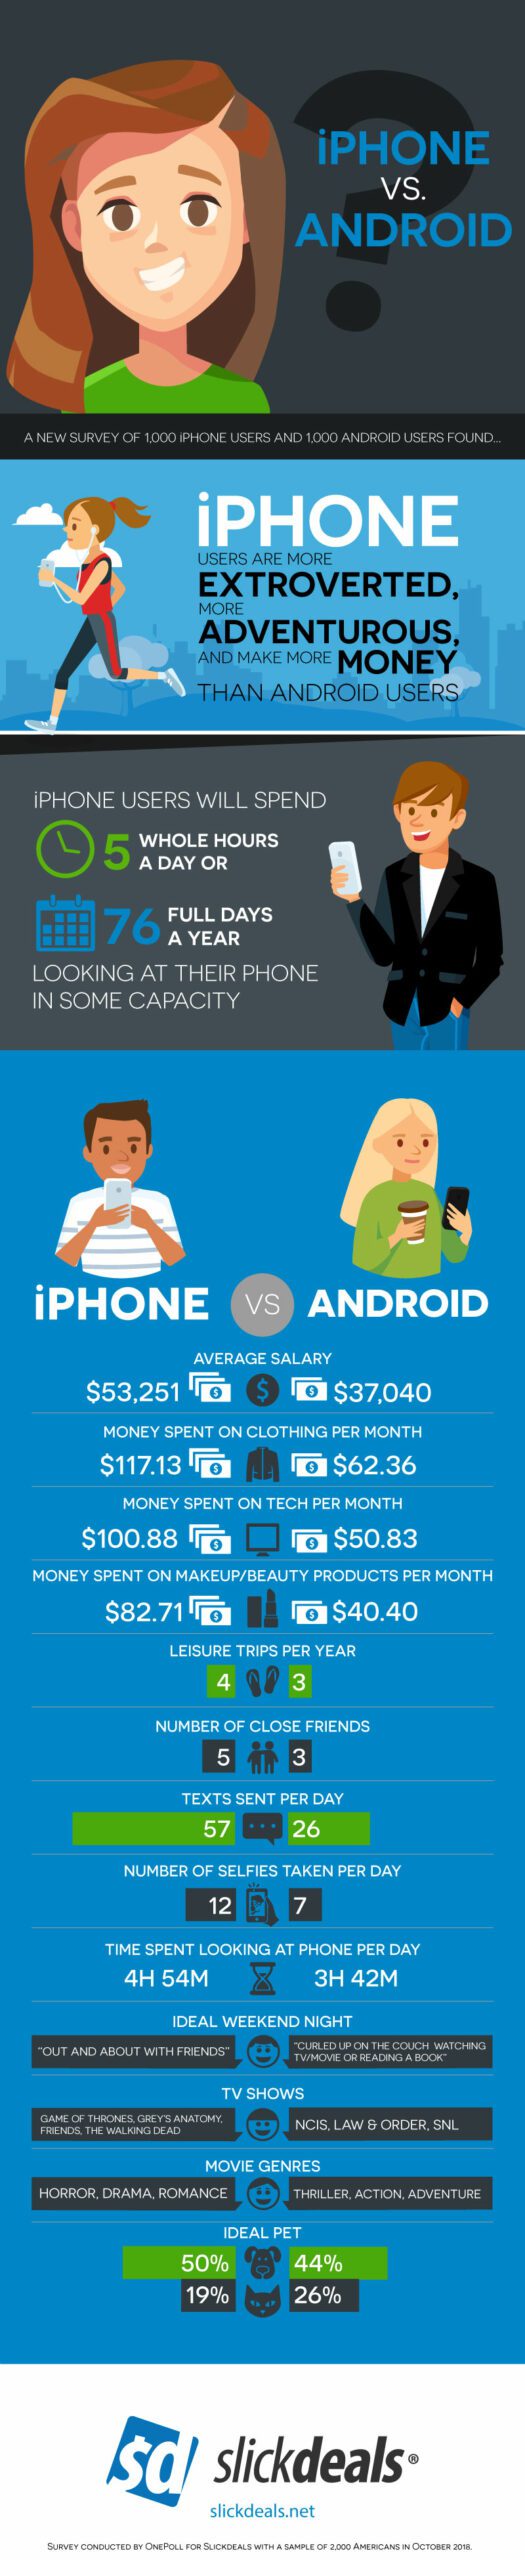
iPhone users are generally happier, more extroverted, more adventurous, and make more money than Android users, according to new research.
A study of 1,000 iPhone owners and 1,000 Android owners found that whether you prefer an iPhone or Android may say a lot about your personality -- and even your spending habits.
The survey, by Slickdeals, pitted the cell phone giants against each other and found iPhone users will shell out $117 on average every month on clothes -- nearly double what an Android user will spend ($62).
The same goes for makeup and beauty products, with the iPhone crowd spending $83 every month on average on such products, double what Android users spend ($40).
Amusingly, iPhone users were also found to be vainer -- taking 12 selfies every day, which is five more than Android users take. Furthermore, iPhone users are more than twice as likely to report that they like being the center of attention.
iPhone users also clearly value an optimal tech experience, spending a whopping $101 every month on tech-related purchases -- Android users will spend half that ($51).
Android users are self-admittedly the more frugal of the groups, with Android users being 25 percent more likely to strongly agree that they think they are a frugal person, and being 19 percent more likely to say they look for deals and discounts “often.”
Said Slickdeals CEO Josh Meyers, “This survey indicates that Android users are generally more frugal than their iPhone counterparts, and on the hunt for savings when shopping. Meanwhile, iPhone users tend to spend more, particularly on items related to self-image such as clothing and cosmetics.”
The results showed that iPhone users were the happier bunch, too, as they were 27 percent more likely to say they were “very happy” with their life. They were also more inclined to have a partner they were in love with, and to enjoy experiencing new things.
iPhone users were also found to be happier with their current job than Android users, with only 20 percent of Android users saying they were very happy with their job, compared to 33 percent of iPhone users.
Not only do iPhone users consider themselves more personable and sociable than Android users, they also have more friends, according to the results -- iPhone users say they have five very close friends on average, and Android users claim to have only three.
This may be because iPhone users are also the more likely bunch to get out of their house or apartment on the weekend and meet people, whereas Android users fancy a quiet night in by themselves with a nice book.
Android users don’t shy away from adventure on the big screen though, as the survey showed it was their favorite movie genre along with action movies and thrillers. Those with iPhones prefer horror films and, interestingly, romance flicks.
But iPhone users are more dependent on their phone than their Android brethren, according to the results.
iPhone users will spend five whole hours a day, or 76 full days a year, looking at their phone in some capacity. That includes sending 58 text messages every day -- over double how many an Android owner will send (26). That also includes four hours of scrolling through social media.
Meyers added, “Overall, we’ve seen a rapid shift from desktop to mobile shopping for consumers. With people spending at least five hours a day on their phone, continued migration towards mobile seems almost inevitable. Here at Slickdeals, the leading crowdsourced shopping platform, our mobile app is at the forefront of this transition, empowering consumers to make better shopping decisions at home or on-the-go.”
Android - $37,040
Android - 26
Android - 3 hours, 42 minutes
Android - 7
Android - Curled up on the couch watching TV/movie or reading a book
Android - 3
Android - 3
Android - $62.36
Android - $50.83
Android - $40.40
Android - 44% prefer dog, 26% prefer cat, 30% no preference
Android - NCIS, Law & Order, SNL
Android - Thriller, Action, Adventure