

By Vanessa Mangru-Kumar // SWNS
NEWS COPY W/ VIDEO + INFOGRAPHIC
On average, the buzz of a good bargain lasts about three and a half hours, according to new research.
A survey of 2,000 Americans examined their shopping habits and pinpointed the precise amount of time that post-purchase glow lasts for, with 216 minutes being the average.
One in 10 respondents stay on cloud nine for the rest of the day, with nearly a quarter of those surveyed riding the wave of a good deal for at least four hours (22%).
Conducted by Talker Research for Ollie’s, the survey found that shoppers won’t be shy about their spoils, either: 59% would brag about finding a good deal to friends (51%), their partner (40%) and members of their extended family (27%).
With 60% claiming they can find a deal on any item, it’s no wonder 54% crown themselves the best bargain hunter they know, up from 34% last year.
But what makes a good deal? Similarly to last year, the average respondent needs to save 36% on an item for it to be worth their time.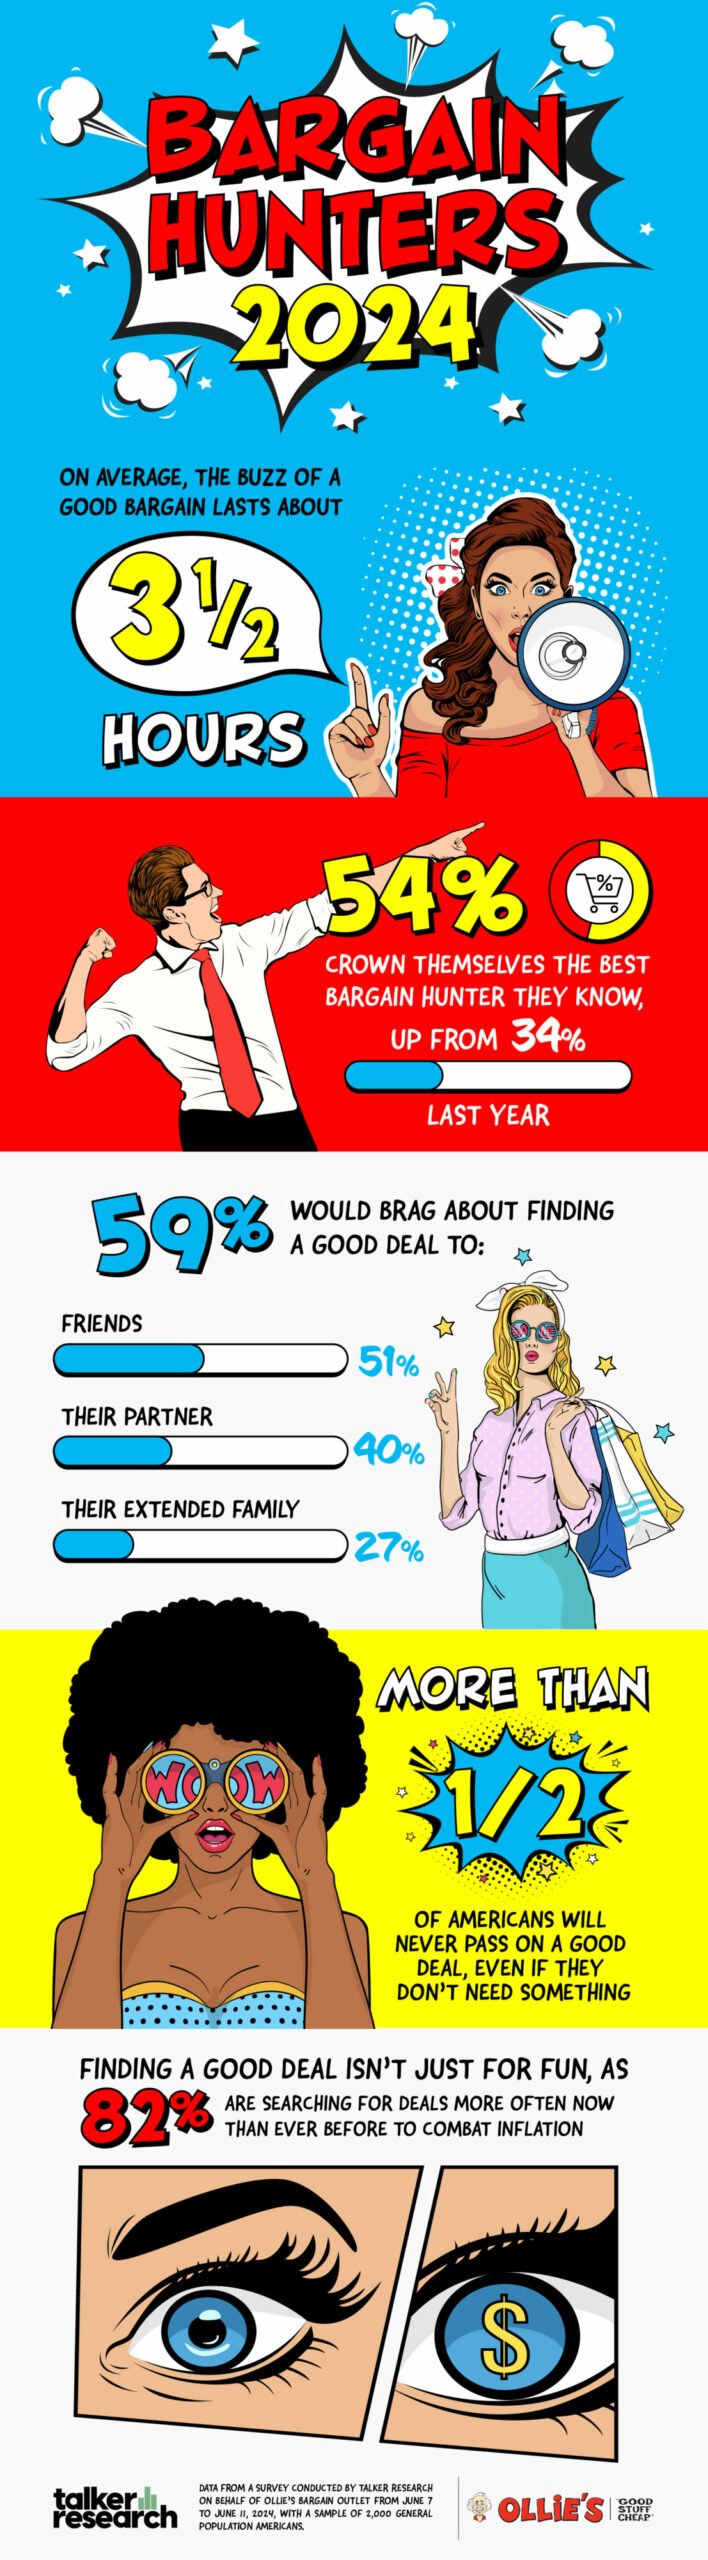
The survey also found that one in five drive an even harder bargain, claiming they need the item to be at least half off.
Time is money for a third of respondents who would only wait up to a week for an item to go on sale before they end up buying it at full price (32%).
To get the most out of their trip, 48% tackle shopping with a plan and mostly or completely stick to it.
Thirty percent admit to veering from their plan when they get into the store, while one in five completely wing their shopping trip.
On average, Americans leave about 14 extra minutes while shopping just to “look around.”
More than half of Americans will never pass on a good deal, even if they don’t need something (56%), which is why the same percentage say they need to avoid certain parts of a store to limit their spending.
And they’re not denying the fun they’re having either, with three-quarters of respondents sharing that they enjoy shopping (74%), particularly at grocery stores and clothing stores (68% each).
Hobby shopping (48%) and home shopping (45%) also ranked high as enjoyable kinds of shopping.
“We’re all about the thrill of bargain hunting,” said John Swygert, chief executive officer of Ollie’s. “We know that finding a great deal can be fun and exciting, and we love being a part of that experience for our customers. It's even better when they share the deals they find with friends and family, spreading the joy of bargains even further.”
Finding a good deal isn’t just for fun, as 82% are searching for deals more often now than ever before to combat inflation (down from 85% last year).
Is it enough? Eight-five percent of those surveyed said the prices of common items have increased where they live over the past year (compared to 91% last year).
Americans still rate gas (47%) and fast food (46%) as the most overpriced items (56% and 45% last year, respectively).
However, the cost of clothing (33% vs. 41%) and personal care items (32% vs. 39% last year, respectively) are less of a concern this year.
Grocery items like meat or fish (42%), eggs (34%) and milk (30%) are also higher in price than respondents want to pay for.
Still, those surveyed shared some of the items that are worth the splurge, with cell phones still being the top choice (21% compared to 23% last year), followed by appliances (20%) and computers or laptops (20%).
For some, food items are also not a compromise, calling out the desire for quality coffee (16%), meat or fish (14%) and snacks (12%).
"As inflation and prices for everything consumers need continue to skyrocket, finding ways to stretch your dollar further is an important skill for consumers,” Swygert said. “That’s why we’re more focused than ever on helping the communities we serve save money and find the best bargains to avoid overpaying for the merchandise they want and need."
THINGS THAT ARE PRICED TOO HIGH 2024 THINGS THAT WERE PRICED TOO HIGH 2023
- Gasoline — 47% 1. Gasoline — 56%
- Fast food — 46% 2. Fast food — 45%
- Meat/fish — 42% 3. Meat/fish — 43%
- Automobiles — 35% 4. Eggs — 43%
- Cell phones — 35% 5. Clothing — 41%
- Eggs — 34% 6. Milk — 40%
- Clothing — 33% 7. Personal care items — 39%
- Personal care items — 32% 8. Snacks — 38%
- Snacks — 31% 9. Automobiles — 38%
- Medicine — 31% 10. Medicine — 38%
WHAT’S WORTH PAYING MORE FOR 2024? WHAT’S WORTH PAYING MORE FOR 2023?
- Cell phones — 21% 1. Cell phones — 23%
- Appliances — 20% 2. Appliances — 22%
- Computers/laptops — 20% 3. Personal care items — 22%
- Personal care items — 19% 4. Computers/laptops — 18%
- TVs — 18% 5. Clothing — 18%
- Laundry materials — 17% 6. Medicine — 17%
- Coffee — 16% 7. Automobiles — 17%
- Clothing — 16% 8. Laundry materials — 16%
- Shoes — 16% 9. Shoes — 16%
- Skincare — 15% 10. Jewelry — 16%
Survey methodology:
This random double-opt-in survey of 2,000 general population Americans was commissioned by Ollie’s Bargain Outlet between June 7 and June 11, 2024. It was conducted by market research company Talker Research, whose team members are members of the Market Research Society (MRS) and the European Society for Opinion and Marketing Research (ESOMAR).